
IIQ Ops Dashboard
How a single plugin collapses four screens of daily IAM operations into one live, filterable, exportable view.
THE PROBLEM
Daily IAM operations should not require a scavenger hunt
If you manage SailPoint IdentityIQ, you already know the routine. It is 9 AM, you want to know how last night's Leaver batch went — and you are already opening three browser tabs. Task Results. Provisioning Transactions. Maybe a saved report. None of them talk to each other.
SailPoint IdentityIQ administrators have no built-in way to monitor daily operations in a single view. Tracking Joiner/Leaver lifecycle events, aggregation task health, and provisioning failures requires navigating across multiple screens — making it time-consuming to spot failures and respond to incidents.
Pain Points
JML events are scattered — Joiner and Leaver task results are buried in the Task Results page with no quick way to filter by lifecycle type or see failures at a glance.
Aggregation failures go unnoticed — There is no dashboard showing which aggregation tasks failed today across all connected applications.
Provisioning failures require deep navigation — Finding failed provisioning transactions means going into Provisioning Transactions and manually filtering.
No single view — Administrators must open 3 to 4 different pages to get a complete picture of what happened today.
No export capability — Native IIQ screens do not offer a quick CSV export of filtered results for audit or reporting purposes in a single place.
DIAGNOSIS
Why IdentityIQ makes this difficult
IdentityIQ's architecture separates concerns cleanly across objects — TaskResult for lifecycle tasks, ProvisioningTransaction for connector operations, and application schemas for aggregation metadata. This is appropriate for the engine. It is problematic for operators who need a holistic view.
The data exists. Every piece of operational information an IIQ administrator needs is already in the database. The gap is presentation — there was no mechanism to assemble it into a live, filterable, exportable operations view.
In a typical IIQ environment, operations teams must open Task Results, Provisioning Transactions, and aggregation reports separately — with no failure summary, no shared date filter, and no common export format across all three. |
SOLUTION
The IIQ Ops Dashboard Plugin
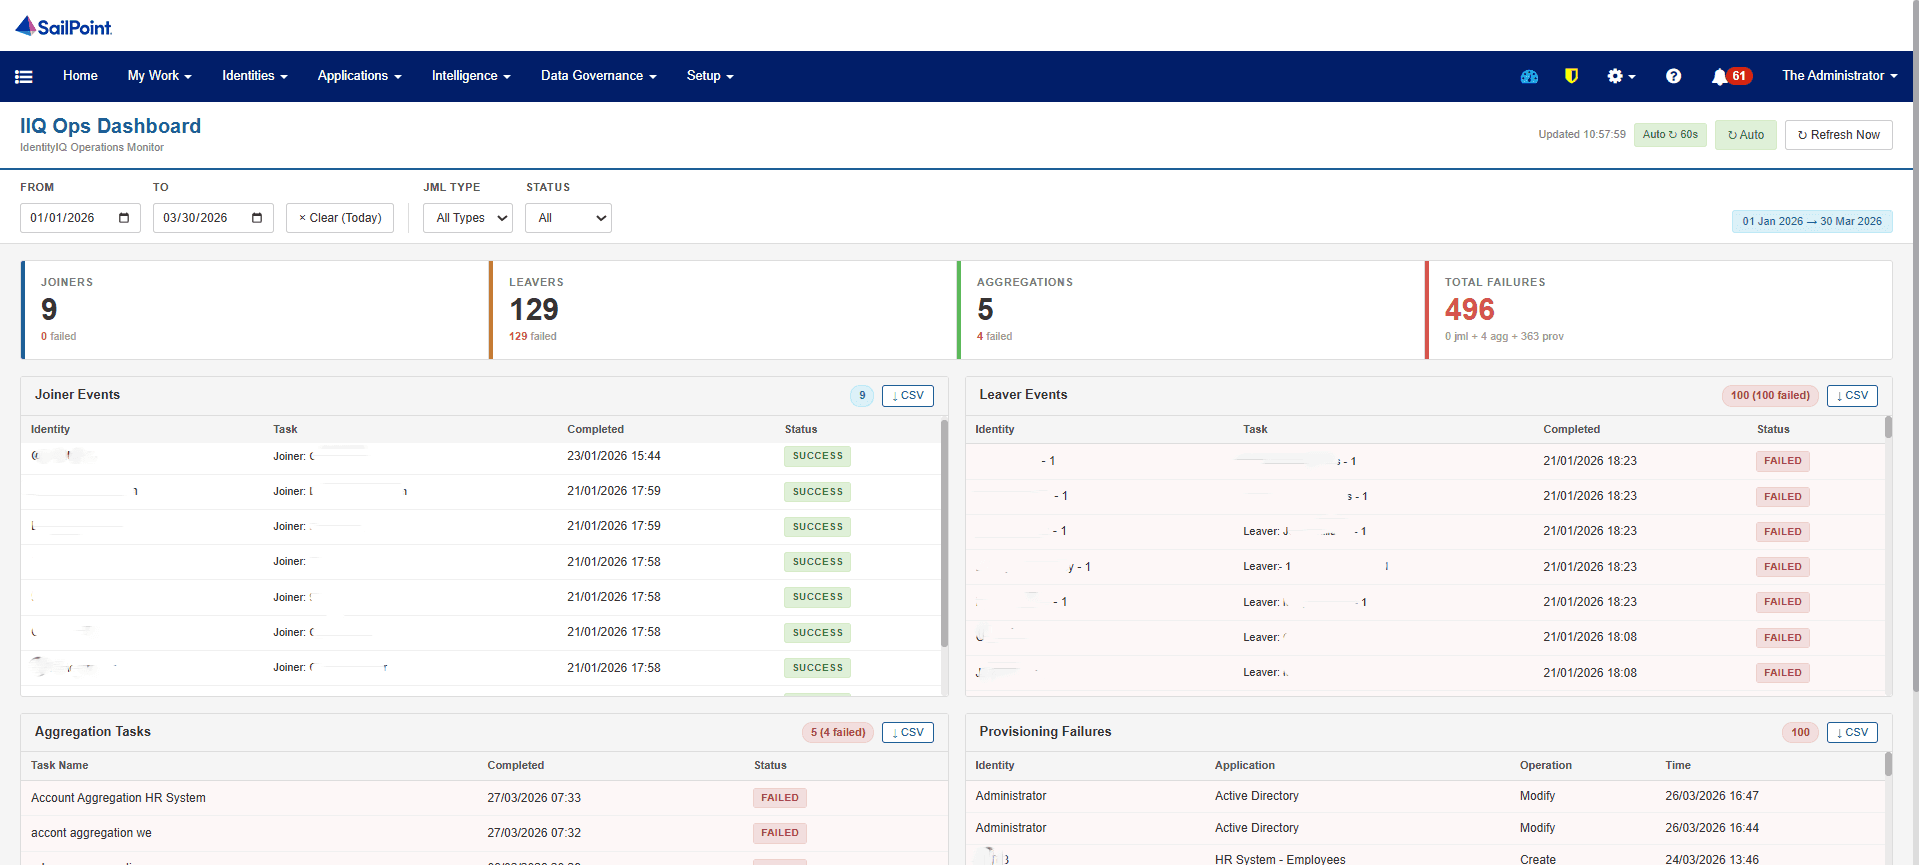
The IIQ Ops Dashboard is an open-source SailPoint plugin that installs in under two minutes and surfaces the complete operational picture in a single real-time page. No Jasper reports. No manual refresh. No tab-switching.
What It Shows
Joiner and Leaver Events — Pulled from TaskResult using case-insensitive name matching. Every JML event is visible with its completion time and pass/fail status.
Aggregation Task Results — Filtered by task name containing 'aggregation', picking up any task regardless of naming convention. Failed aggregations are immediately visible.
Provisioning Failures — Pulled directly from ProvisioningTransaction filtered by status = Failed. Displays identity, application, operation, and timestamp.
KPI Summary Tiles — Four summary tiles at the top showing total counts and failure counts for Joiners, Leavers, Aggregations, and Total Failures at a glance.
Date Range Filter — Narrows results to any time period with a Today shortcut that clears both filters instantly.
CSV Export per Panel — Downloads all records matching the current filter — not limited to the 100 shown in the UI — for audit and reporting purposes.
Auto-Refresh — The dashboard refreshes automatically every 60 seconds, keeping the view current without manual intervention.
INSTALLATION
Getting Started in Three Steps
The plugin uses SailPoint's standard plugin framework. No server restart, no database changes, no external dependencies are required.
Open Plugin Management
In IdentityIQ, navigate to Setup > Plugins > New Plugin. System Administrator access is required.
Upload the Plugin
Upload IIQOpsDashboard.zip. IdentityIQ validates, deploys, and activates the plugin immediately.
Launch from the Navigation Bar
A new icon appears in the IIQ header immediately. Click it and the dashboard is live.
Technical Notes
The plugin queries IIQ's internal SailPointContext to fetch TaskResult and ProvisioningTransaction objects. All filtering is performed server-side. The CSV export bypasses the 100-record UI limit by running the full filtered query independently of the display layer.
// Joiner/Leaver filter — case-insensitive task name match QueryOptions qo = new QueryOptions(); qo.addFilter(Filter.ignoreCase( Filter.like("name", "joiner", MatchMode.ANYWHERE) )); qo.addFilter(Filter.ge("completed", fromDate)); qo.addFilter(Filter.le("completed", toDate)); qo.addOrdering("completed", false); |
IMPACT
What Changes When You Have This
The most immediate benefit is behavioural. When the cost of checking operations drops to opening one tab, administrators actually check. Incidents get caught in minutes instead of hours. Leaver failures do not linger for days unnoticed. Aggregation breakdowns are escalated before they affect downstream provisioning.
The CSV export per panel changes the audit workflow substantially. Instead of manually assembling a list of failed provisioning transactions for a compliance review, it is a single click. The filter is already applied and the export retrieves the full result set.
For teams running IdentityIQ across a large enterprise — hundreds of connected applications, thousands of identity events per day — this dashboard is the difference between reactive firefighting and proactive operational awareness.
SOURCE CODE
Open Source
The full plugin source is available on GitHub. The codebase can be forked, extended, or adapted to fit specific environment requirements. Contributions are welcome.
github.com/Malarvanan/IIQ-Operations-Dashboard

