
Microsoft Power BI
Date Posted:
Category:
Technology
Author:
Sowmya
Microsoft Power BI
Date Posted:
Category:
Technology
Author:
Sowmya
Microsoft Power BI
Date Posted:
Category:
Technology
Author:
Sowmya
Get your Tailored Quote for your Organisation
Get your Tailored Quote for your Organisation
Get your Tailored Quote for your Organisation
Power BI Guide for Beginners: Introduction, Key Uses & Step-by-Step Process
Introduction:
Power BI is a powerful business analytics tool developed by Microsoft that enables users to visualize their data, share insights across an organization, and embed them in an app or website. Power BI is a collection of software services, apps, and connectors that work together to transform raw data into interactive dashboards and actionable insights. It allows users to connect to various data sources, clean and shape data and visualize it using charts, graphs and etc...
Uses of Power BI:
Business Intelligence & Analytics: Create reports and dashboards to analyse business performance.
Data Visualization: Transform complex data into easy-to-understand visuals (charts, graphs, maps).
Data Integration: Power BI can connect to and combine data from multiple sources like Excel, SQL databases, cloud services (Azure, Salesforce, etc.), and web APIs for unified reporting.
Real-Time Monitoring: Track metrics and Key Performance Indicators (KPI) in real time using live dashboards.
Data Modelling: Clean, transform, and model data using Power Query and DAX (Data Analysis Expressions).
Collaboration: Users can easily share reports and dashboards with team members or stakeholders via the Power BI Service or embed them into apps, websites, or Microsoft Teams.
Steps:
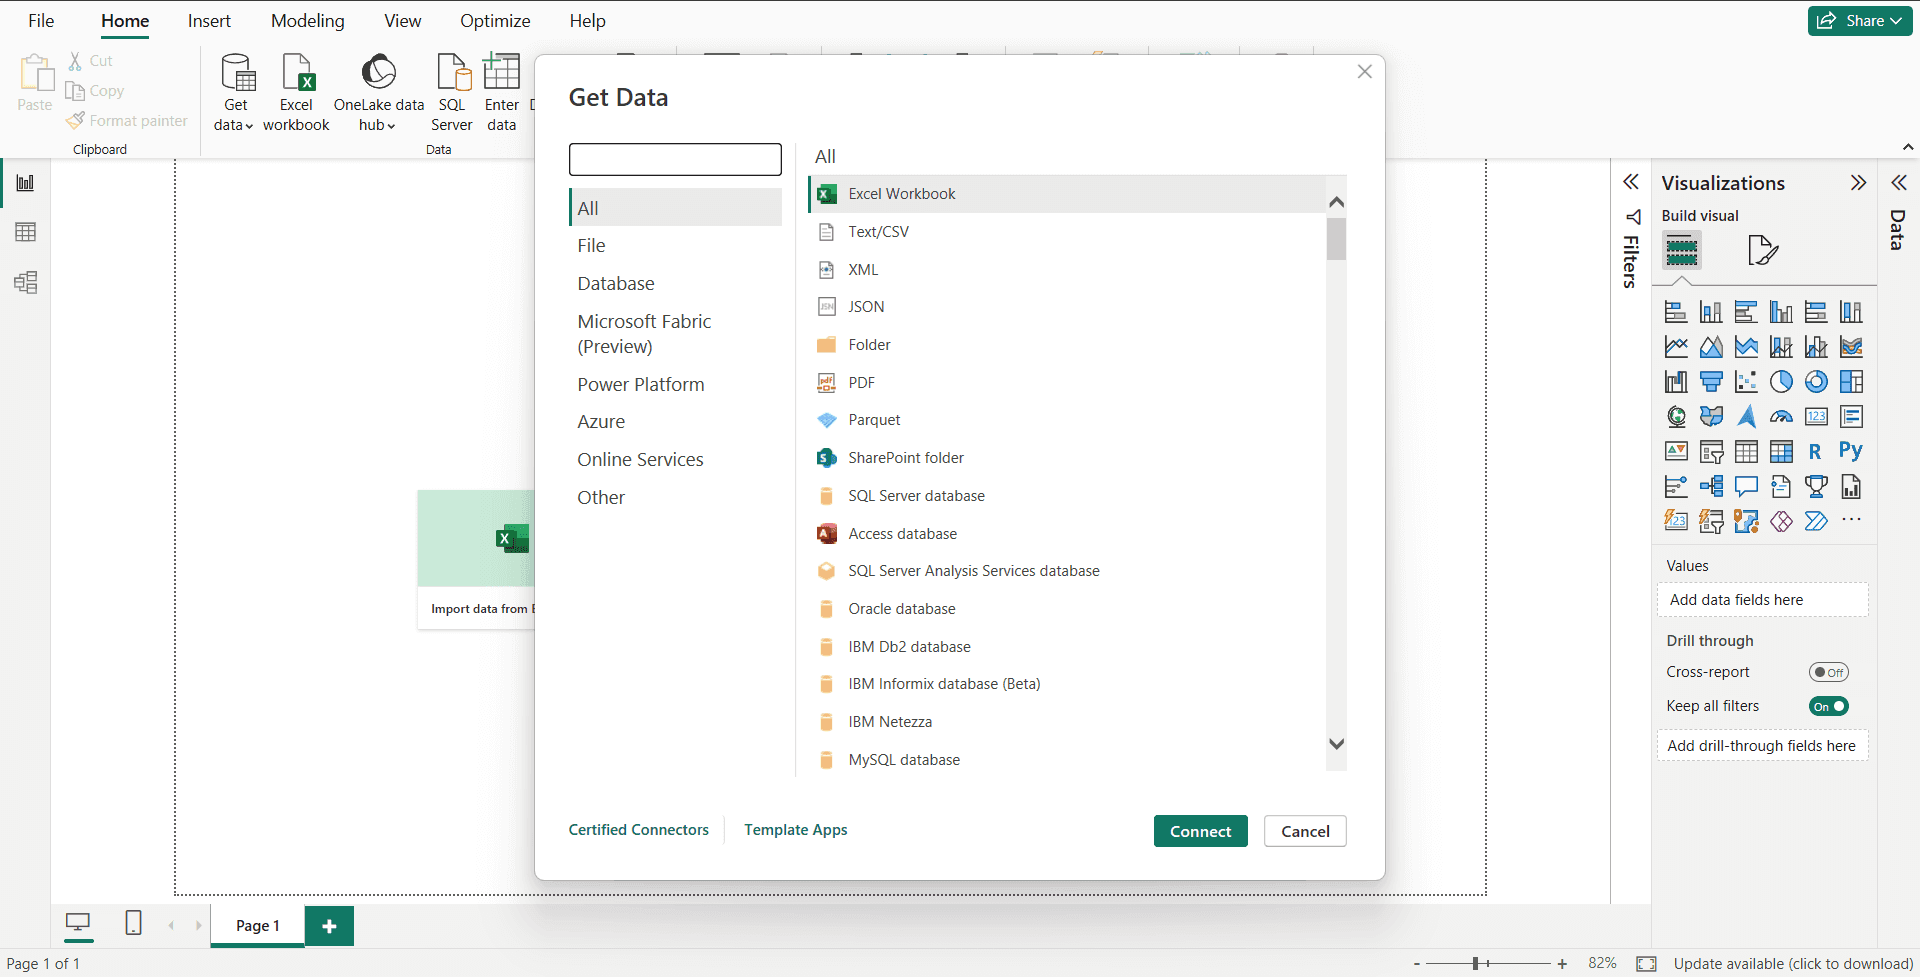
Step 1: Connect to Data Sources
Open Power BI Desktop
Click “Get Data” and choose your data source (Excel, SQL Server, web, etc.)
Load and preview your data
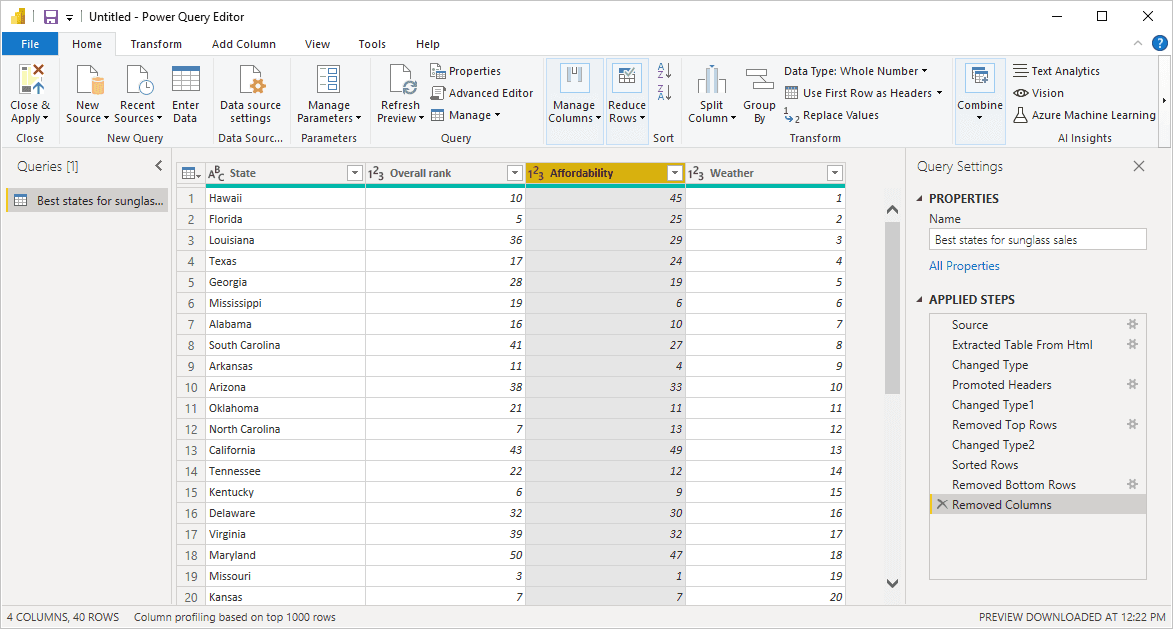
Step 2: Clean and Transform Data (Power Query Editor)
Open the Power Query Editor
Perform data cleaning:
Remove duplicates or nulls
Rename columns
Change data types
Merge or append queries
Pivoting and Unpivoting
Apply and close the editor
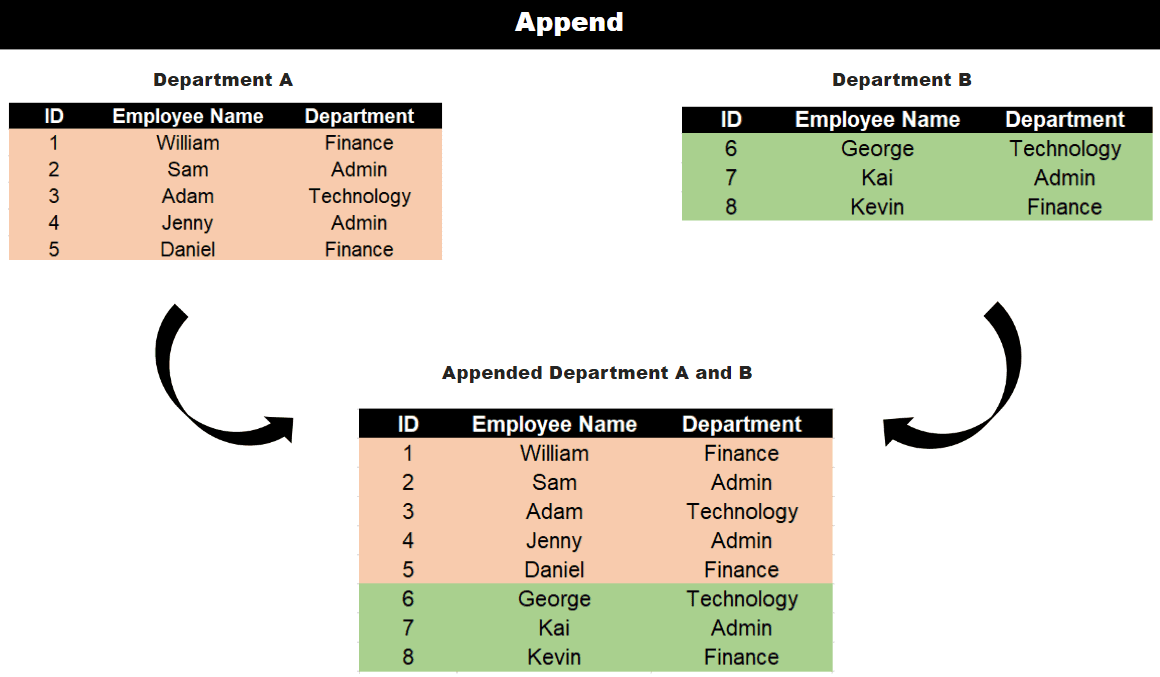
Append queries - The append operation creates a single table by adding the contents of one or more tables to another, and aggregates the column headers from the tables to create the schema for the new table.
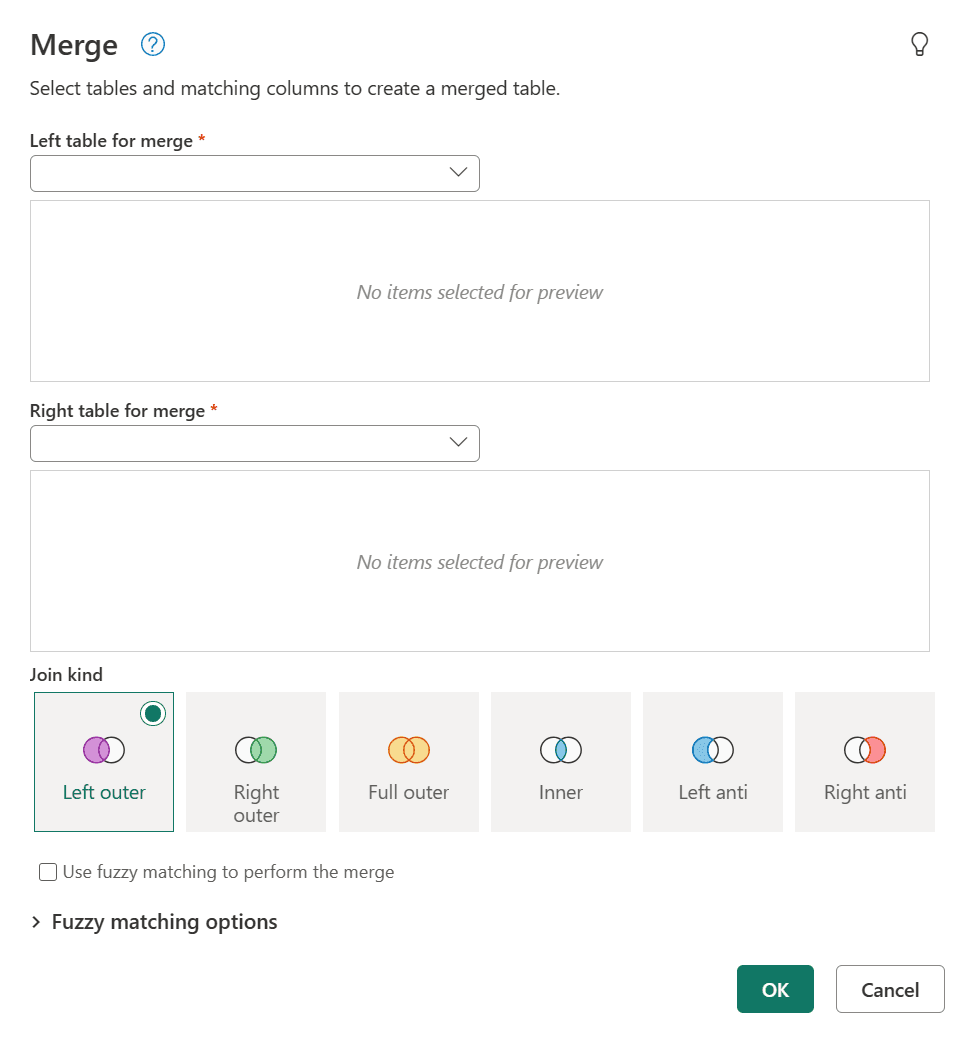
Merge queries: A merge queries operation joins two existing tables together based on matching values from one or multiple columns. You can choose to use different types of joins (Left outer, Right outer, full outer, Inner, left anti join, Right anti join) depending on the output you want.
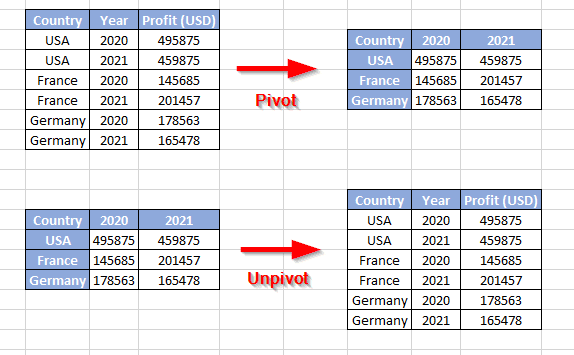
Pivoting - is the process of transforming rows into columns, where unique values in a row column become new column headers.
Unpivoting- is the process of transforming columns into rows, where column headers become values in a new column.
Step 3: Create Data Model
Define relationships between tables (drag and drop in the Model view)
Set primary and foreign keys
Create calculated columns or measures using DAX (Data Analysis Expressions)
Data Analysis Expressions (DAX) - is a library of functions and operators that can be combined to build formulas and expressions in Power BI
Relationship: Relationship connects two tables through a common column (often called a key). This allows the data in the two tables to work together in visualizations and calculations.
For example:
• Customers table (Customer ID, Name, Location)
• Sales table (Sale ID, Date, Customer ID, Amount)
Power BI uses primary keys and foreign keys to define relationships
Primary Key: Unique identifier in the “one” side of a relationship (e.g., Customer ID in Customers table)
Foreign Key: Refers to that identifier in another table (e.g., Customer ID in Sales table)
To analyze total sales per customer, Power BI needs to link these tables through the Customer ID column.
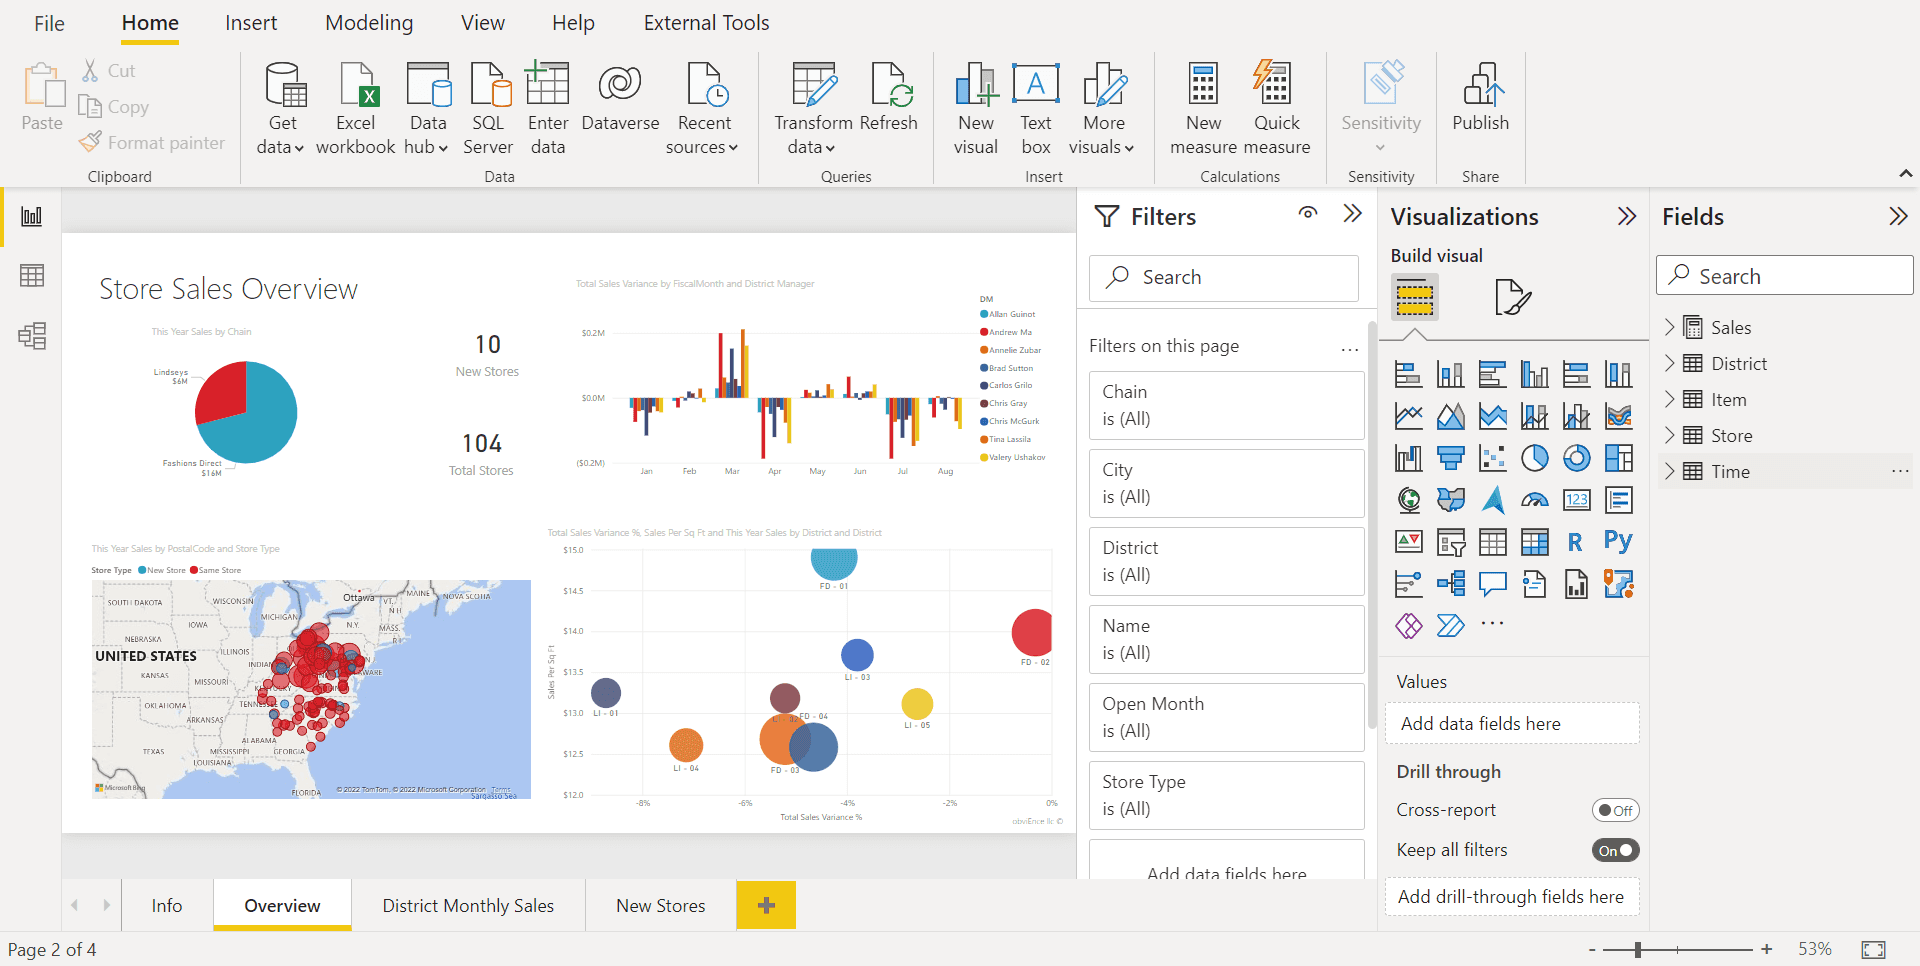
Step 4: Build Visuals
Drag fields onto the canvas to create visuals (charts, tables, maps, etc.)
Customize visuals with filters, slicers, and drill-downs
Use themes and formatting for consistent design
Step 5: Add Interactivity
Add slicers, tooltips, and buttons
Enable drill-through and bookmark navigation if needed
Use Q&A visual to enable natural language queries
Step 6: Review and Validate
Cross-check calculations and filters
Make sure visuals are accurate and easy to interpret
Test interactivity and page navigation
Step 7: Publish the Report
Click “Publish” in Power BI Desktop
Choose your Power BI Workspace (cloud-based)
Share with team members or embed in apps, websites, or Microsoft Teams
Optional: Set Up Refresh Schedule
In Power BI Service, go to dataset settings
Set up a refresh schedule if your data source updates regularly
Conclusion:
Power BI is a powerful and accessible business intelligence tool that empowers individuals and organizations to make data-driven decisions with confidence. From connecting diverse data sources to creating visually compelling reports and dashboards, Power BI simplifies complex data analysis. Whether you're a beginner exploring data or a professional building advanced report, Power BI provides the flexibility, scalability, and insights you need to drive better outcomes. By understanding its core features, practical uses, and step-by-step process, you can unlock the full potential of your data and gain a competitive edge in today’s data-driven world.
Power BI Guide for Beginners: Introduction, Key Uses & Step-by-Step Process
Introduction:
Power BI is a powerful business analytics tool developed by Microsoft that enables users to visualize their data, share insights across an organization, and embed them in an app or website. Power BI is a collection of software services, apps, and connectors that work together to transform raw data into interactive dashboards and actionable insights. It allows users to connect to various data sources, clean and shape data and visualize it using charts, graphs and etc...
Uses of Power BI:
Business Intelligence & Analytics: Create reports and dashboards to analyse business performance.
Data Visualization: Transform complex data into easy-to-understand visuals (charts, graphs, maps).
Data Integration: Power BI can connect to and combine data from multiple sources like Excel, SQL databases, cloud services (Azure, Salesforce, etc.), and web APIs for unified reporting.
Real-Time Monitoring: Track metrics and Key Performance Indicators (KPI) in real time using live dashboards.
Data Modelling: Clean, transform, and model data using Power Query and DAX (Data Analysis Expressions).
Collaboration: Users can easily share reports and dashboards with team members or stakeholders via the Power BI Service or embed them into apps, websites, or Microsoft Teams.
Steps:
Step 1: Connect to Data Sources
Open Power BI Desktop
Click “Get Data” and choose your data source (Excel, SQL Server, web, etc.)
Load and preview your data
Step 2: Clean and Transform Data (Power Query Editor)
Open the Power Query Editor
Perform data cleaning:
Remove duplicates or nulls
Rename columns
Change data types
Merge or append queries
Pivoting and Unpivoting
Apply and close the editor
Append queries - The append operation creates a single table by adding the contents of one or more tables to another, and aggregates the column headers from the tables to create the schema for the new table.
Merge queries: A merge queries operation joins two existing tables together based on matching values from one or multiple columns. You can choose to use different types of joins (Left outer, Right outer, full outer, Inner, left anti join, Right anti join) depending on the output you want.
Pivoting - is the process of transforming rows into columns, where unique values in a row column become new column headers.
Unpivoting- is the process of transforming columns into rows, where column headers become values in a new column.
Step 3: Create Data Model
Define relationships between tables (drag and drop in the Model view)
Set primary and foreign keys
Create calculated columns or measures using DAX (Data Analysis Expressions)
Data Analysis Expressions (DAX) - is a library of functions and operators that can be combined to build formulas and expressions in Power BI
Relationship: Relationship connects two tables through a common column (often called a key). This allows the data in the two tables to work together in visualizations and calculations.
For example:
• Customers table (Customer ID, Name, Location)
• Sales table (Sale ID, Date, Customer ID, Amount)
Power BI uses primary keys and foreign keys to define relationships
Primary Key: Unique identifier in the “one” side of a relationship (e.g., Customer ID in Customers table)
Foreign Key: Refers to that identifier in another table (e.g., Customer ID in Sales table)
To analyze total sales per customer, Power BI needs to link these tables through the Customer ID column.
Step 4: Build Visuals
Drag fields onto the canvas to create visuals (charts, tables, maps, etc.)
Customize visuals with filters, slicers, and drill-downs
Use themes and formatting for consistent design
Step 5: Add Interactivity
Add slicers, tooltips, and buttons
Enable drill-through and bookmark navigation if needed
Use Q&A visual to enable natural language queries
Step 6: Review and Validate
Cross-check calculations and filters
Make sure visuals are accurate and easy to interpret
Test interactivity and page navigation
Step 7: Publish the Report
Click “Publish” in Power BI Desktop
Choose your Power BI Workspace (cloud-based)
Share with team members or embed in apps, websites, or Microsoft Teams
Optional: Set Up Refresh Schedule
In Power BI Service, go to dataset settings
Set up a refresh schedule if your data source updates regularly
Conclusion:
Power BI is a powerful and accessible business intelligence tool that empowers individuals and organizations to make data-driven decisions with confidence. From connecting diverse data sources to creating visually compelling reports and dashboards, Power BI simplifies complex data analysis. Whether you're a beginner exploring data or a professional building advanced report, Power BI provides the flexibility, scalability, and insights you need to drive better outcomes. By understanding its core features, practical uses, and step-by-step process, you can unlock the full potential of your data and gain a competitive edge in today’s data-driven world.
Stay tuned to our blog to see more posts about
Sailpoint products implementation and its related updates.
Stay tuned to our blog to see more posts about SailPoint products implementation and its related updates.
Category:
Category:
Technology
Technology
Power BI Guide for Beginners: Introduction, Key Uses & Step-by-Step Process
Introduction:
Power BI is a powerful business analytics tool developed by Microsoft that enables users to visualize their data, share insights across an organization, and embed them in an app or website. Power BI is a collection of software services, apps, and connectors that work together to transform raw data into interactive dashboards and actionable insights. It allows users to connect to various data sources, clean and shape data and visualize it using charts, graphs and etc...
Uses of Power BI:
Business Intelligence & Analytics: Create reports and dashboards to analyse business performance.
Data Visualization: Transform complex data into easy-to-understand visuals (charts, graphs, maps).
Data Integration: Power BI can connect to and combine data from multiple sources like Excel, SQL databases, cloud services (Azure, Salesforce, etc.), and web APIs for unified reporting.
Real-Time Monitoring: Track metrics and Key Performance Indicators (KPI) in real time using live dashboards.
Data Modelling: Clean, transform, and model data using Power Query and DAX (Data Analysis Expressions).
Collaboration: Users can easily share reports and dashboards with team members or stakeholders via the Power BI Service or embed them into apps, websites, or Microsoft Teams.
Steps:
Step 1: Connect to Data Sources
Open Power BI Desktop
Click “Get Data” and choose your data source (Excel, SQL Server, web, etc.)
Load and preview your data
Step 2: Clean and Transform Data (Power Query Editor)
Open the Power Query Editor
Perform data cleaning:
Remove duplicates or nulls
Rename columns
Change data types
Merge or append queries
Pivoting and Unpivoting
Apply and close the editor
Append queries - The append operation creates a single table by adding the contents of one or more tables to another, and aggregates the column headers from the tables to create the schema for the new table.
Merge queries: A merge queries operation joins two existing tables together based on matching values from one or multiple columns. You can choose to use different types of joins (Left outer, Right outer, full outer, Inner, left anti join, Right anti join) depending on the output you want.
Pivoting - is the process of transforming rows into columns, where unique values in a row column become new column headers.
Unpivoting- is the process of transforming columns into rows, where column headers become values in a new column.
Step 3: Create Data Model
Define relationships between tables (drag and drop in the Model view)
Set primary and foreign keys
Create calculated columns or measures using DAX (Data Analysis Expressions)
Data Analysis Expressions (DAX) - is a library of functions and operators that can be combined to build formulas and expressions in Power BI
Relationship: Relationship connects two tables through a common column (often called a key). This allows the data in the two tables to work together in visualizations and calculations.
For example:
• Customers table (Customer ID, Name, Location)
• Sales table (Sale ID, Date, Customer ID, Amount)
Power BI uses primary keys and foreign keys to define relationships
Primary Key: Unique identifier in the “one” side of a relationship (e.g., Customer ID in Customers table)
Foreign Key: Refers to that identifier in another table (e.g., Customer ID in Sales table)
To analyze total sales per customer, Power BI needs to link these tables through the Customer ID column.
Step 4: Build Visuals
Drag fields onto the canvas to create visuals (charts, tables, maps, etc.)
Customize visuals with filters, slicers, and drill-downs
Use themes and formatting for consistent design
Step 5: Add Interactivity
Add slicers, tooltips, and buttons
Enable drill-through and bookmark navigation if needed
Use Q&A visual to enable natural language queries
Step 6: Review and Validate
Cross-check calculations and filters
Make sure visuals are accurate and easy to interpret
Test interactivity and page navigation
Step 7: Publish the Report
Click “Publish” in Power BI Desktop
Choose your Power BI Workspace (cloud-based)
Share with team members or embed in apps, websites, or Microsoft Teams
Optional: Set Up Refresh Schedule
In Power BI Service, go to dataset settings
Set up a refresh schedule if your data source updates regularly
Conclusion:
Power BI is a powerful and accessible business intelligence tool that empowers individuals and organizations to make data-driven decisions with confidence. From connecting diverse data sources to creating visually compelling reports and dashboards, Power BI simplifies complex data analysis. Whether you're a beginner exploring data or a professional building advanced report, Power BI provides the flexibility, scalability, and insights you need to drive better outcomes. By understanding its core features, practical uses, and step-by-step process, you can unlock the full potential of your data and gain a competitive edge in today’s data-driven world.
Stay tuned to our blog to see more posts about
Sailpoint products implementation and its related updates.
Category:
Technology


