
Building SailPoint Reports Using Power BI Desktop
Date Posted:
Category:
Security
Author:
Valarmathi
Building SailPoint Reports Using Power BI Desktop
Date Posted:
Category:
Security
Author:
Valarmathi
Building SailPoint Reports Using Power BI Desktop
Date Posted:
Category:
Security
Author:
Valarmathi
Get your Tailored Quote for your Organisation
Get your Tailored Quote for your Organisation
Get your Tailored Quote for your Organisation
How to Build SailPoint Reports in Power BI Desktop
Introduction Of Building SailPoint Reports Using Power BI Desktop
The Power BI is the Microsoft's Business Intelligence tool for analytics and reporting. Here it converts data into dashboards, visuals, and interactive reports. It supports the real-time analytics, automated insights, and cloud-based sharing. Also, it uses in-memory VertiPaq engine for high-speed processing for generating the reports. The Power BI is suitable for business users, analysts, and IAM teams.
Why We Use Power BI
By using Power BI, it reduces manual reporting and simplifies complex data analysis and it provides a single place to view business KPIs and metrics. Helps decision-makers with interactive filtering and reports. BI Automates data refresh and reduces human error.
It connects more than 100 data sources from another data source. Using Power BI, we can create reports, dashboards, KPIs, scorecards, and custom visuals and can perform time-based analysis like YTD, QTD, YoY, and forecasting. Here it builds DAX measures for advanced calculations and business logic.
We can get data from another sources that includes,
Files – Excel, CSV, Json, Text, PDF, Folder
Databases – SQL Server, MYSQL, Sybase, Oracle, Access Databases
Microsoft Fabric – Dataflows, Warehouse, Lakehouse, KQL Databases
Power Platform – Power BI dataflows, Dataflows, Dataverse
Azure – Azure Database, Table Storage, Data Explorer, Resource Graph
Online Services – SharePoint online list, Salesforce objects & Reports, Google & Adobe analytics and other online service platforms.
Other Platforms like Web, Google Sheets, Get data from creating Blank Query
Power BI Components
Power BI Desktop: Data modeling, DAX, and report creation
Power BI Service: Online publishing, collaboration, scheduled refresh
Power BI Mobile: Access reports on phones & tablets
Power BI Gateway: Secure connection to on-premise data sources
Power Query: ETL transformation tool for cleaning data.
How Power BI Connects to SailPoint ISC
Power BI can connect to SailPoint ISC data for analytics and reporting and Identity data can be visualized in dashboards. It helps identity governance and compliance for provides real-time insights for decision-making and audit needs.
Connects SailPoint ISC using Base URL, PAT – Client Credentials
Data pulled using REST API
Can also load exported ISC data, reports.
What Data Power BI Can Use from SailPoint
Identity & accounts list
Entitlements, roles, access profiles
SOD violations & exceptions
Certifications & reports
Provisioning activity logs & reports
How to Connect to Data Sources
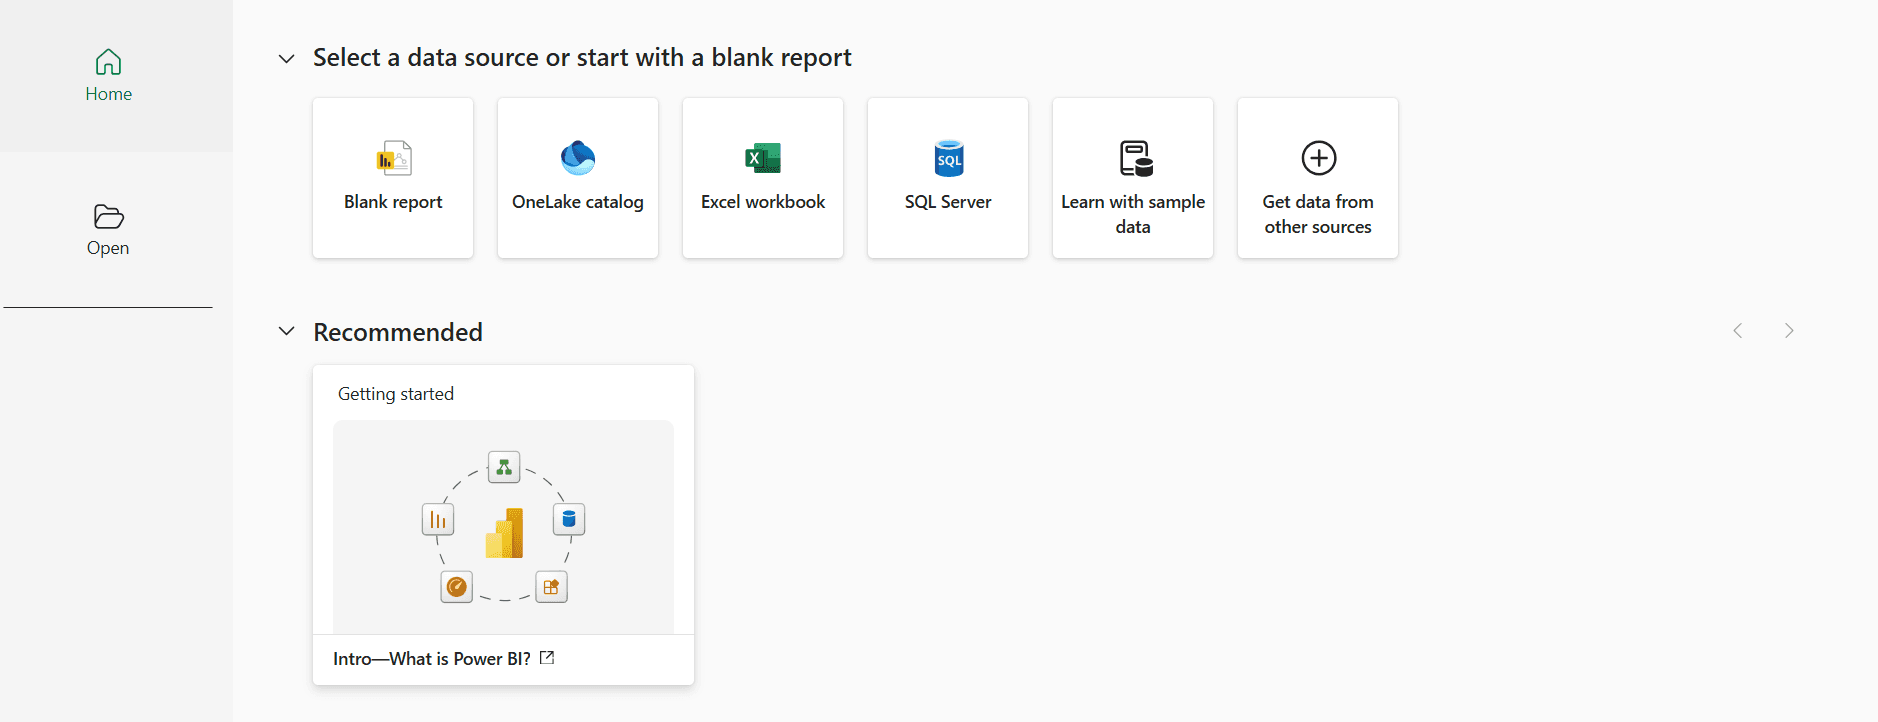
Open Power BI desktop, select a Data Source by clicking Get Data from Other Source option.
It will open the Power BI UI.
In the UI a prompt option will be display as in Picture 2.
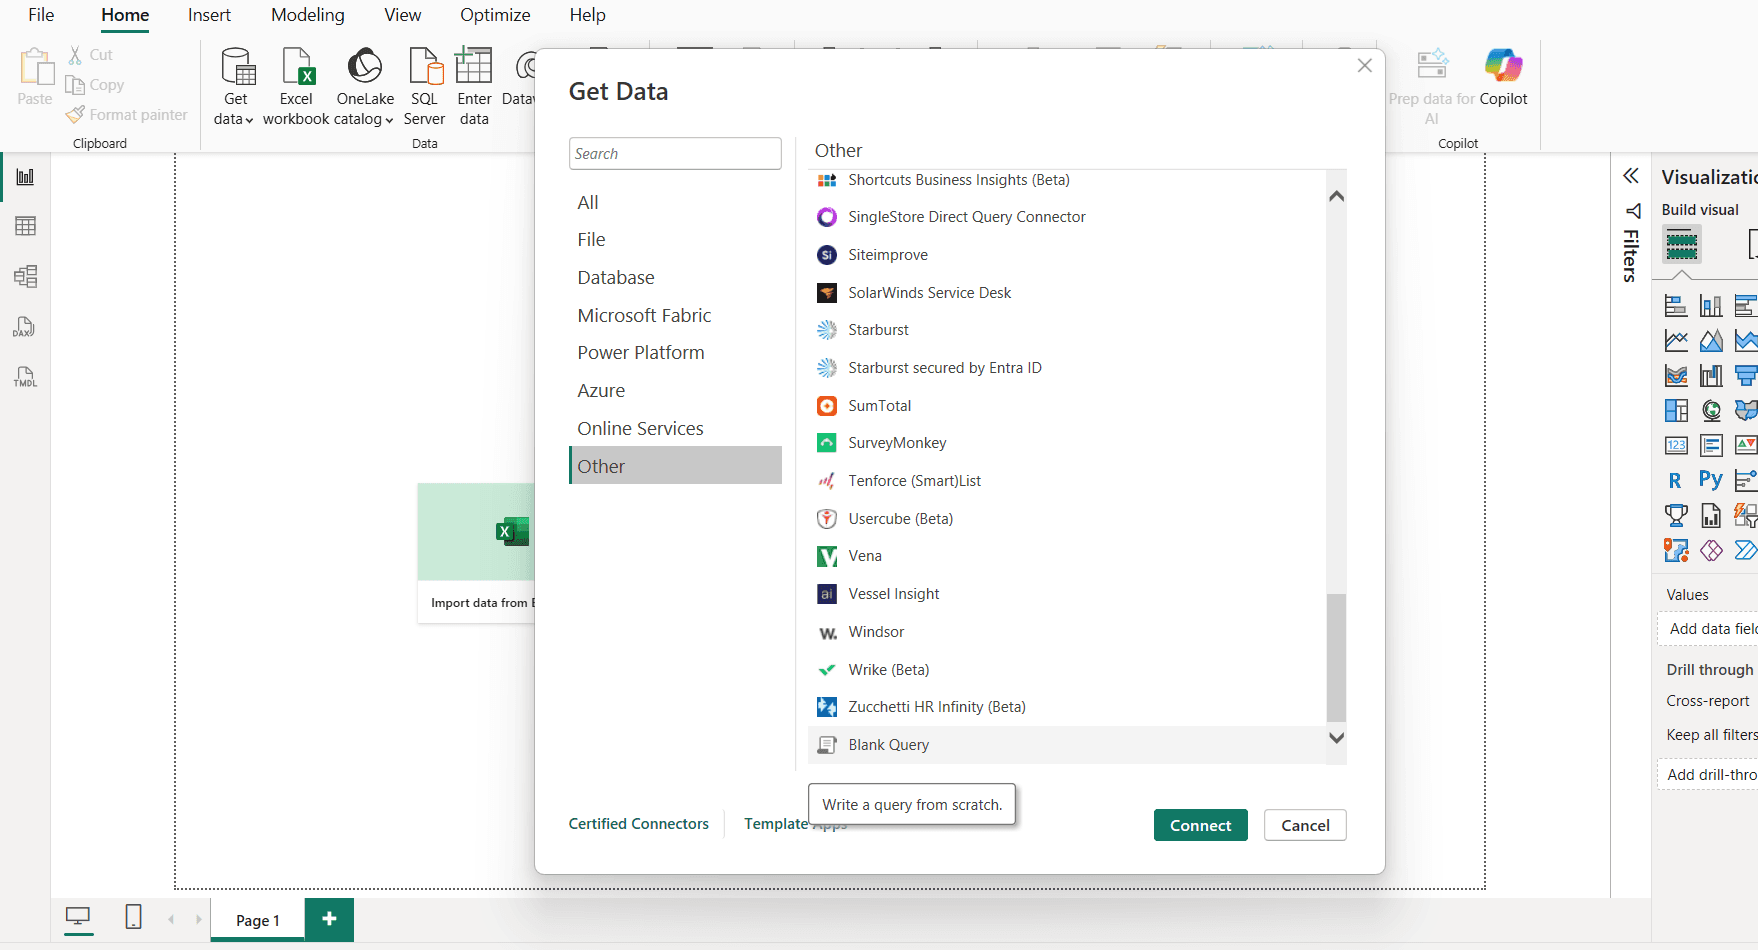
In Get Data page -> Choose other option -> select Blank Query -> Connect
After connect the Power Query Editor gets open.
Connecting SailPoint ISC into the Power BI
In Power Query Editor, for ISC connection we need Base URL, PAT – Client ID, Client Credentials.
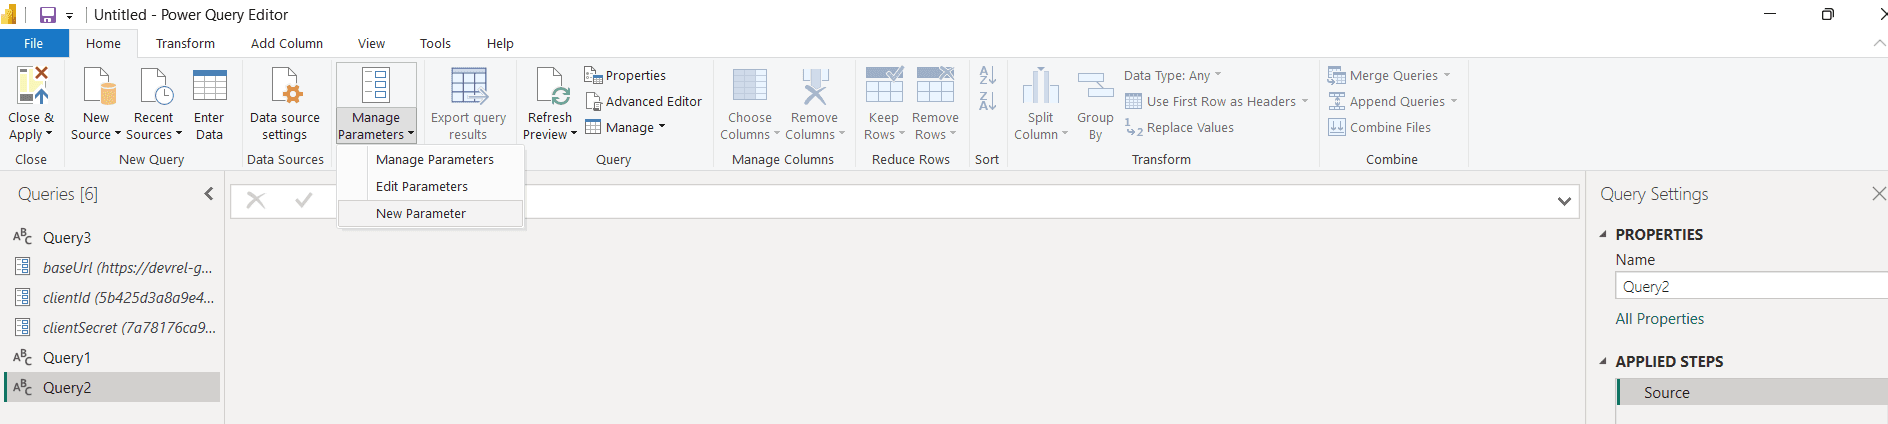
Adding the baseUrl, clientId, clientSecret in the parameters so you can don’t need to rewrite again.
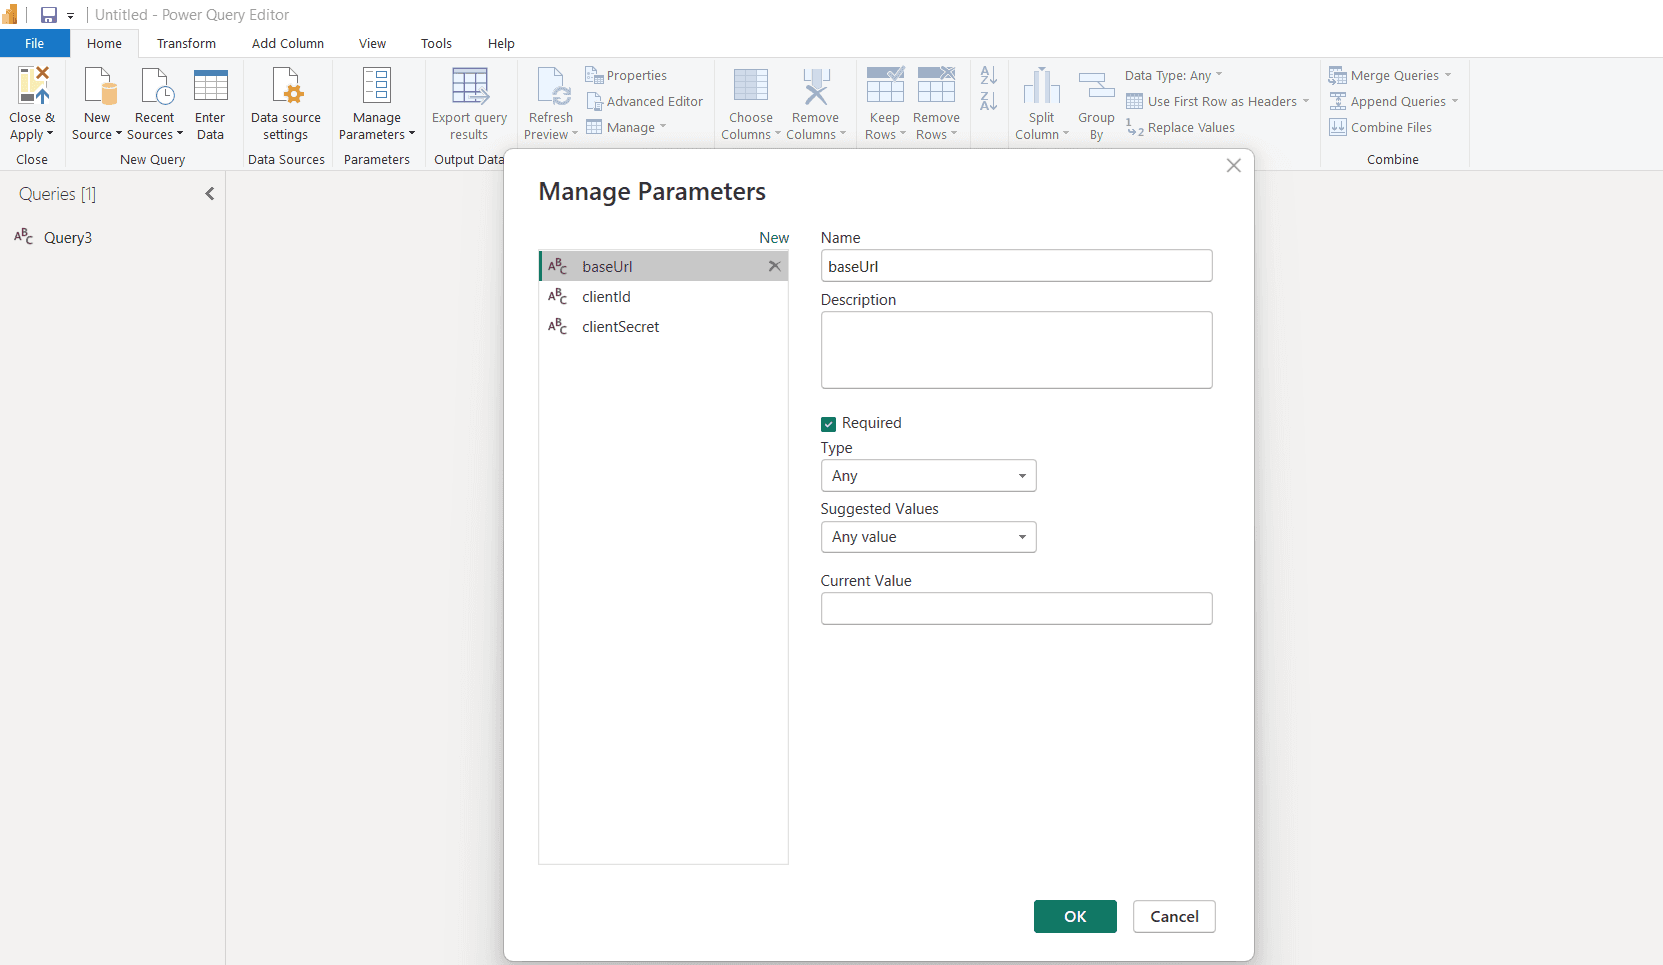
To Create Parameters, go to Manage Parameters -> New Parameter then add Parameters one by one by clicking New in the same page.
Provide details like parameter name, add the url, id, secret in the Current Value field for each specified one and click ok.
The Parameters will add under the Query.
In Advance Editor, proceed with the connection logic.
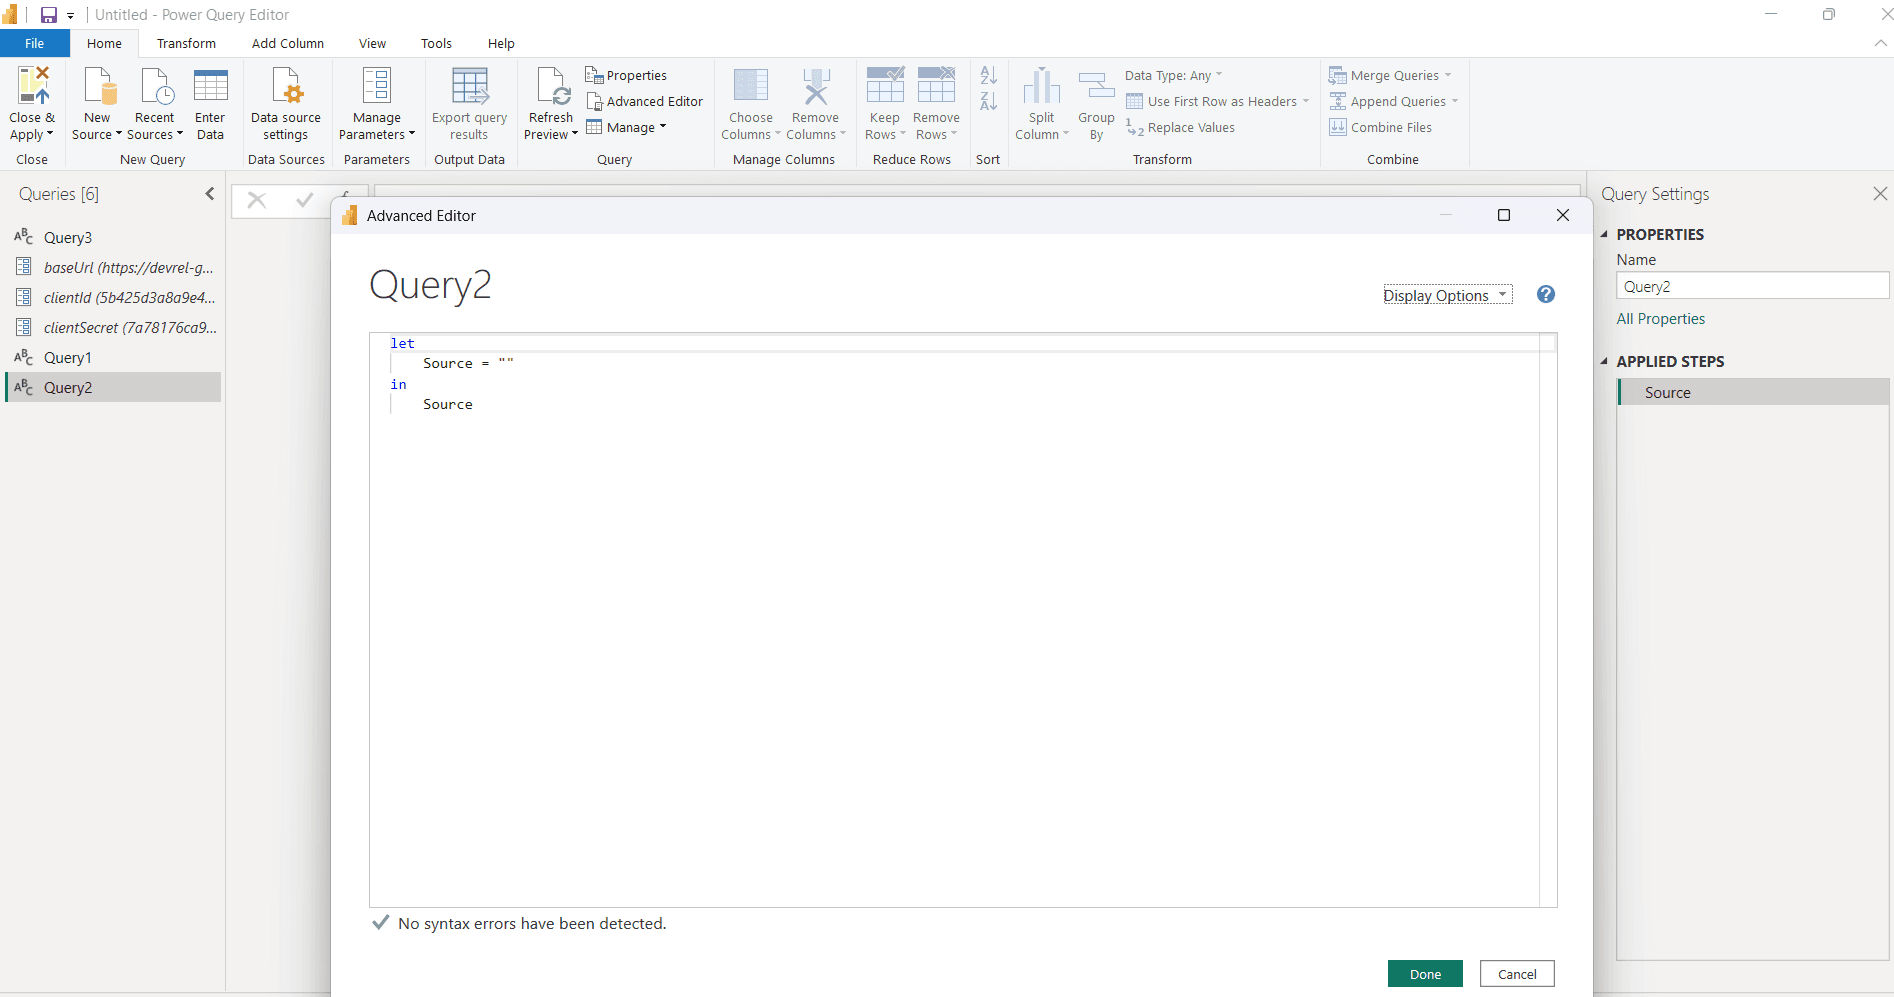
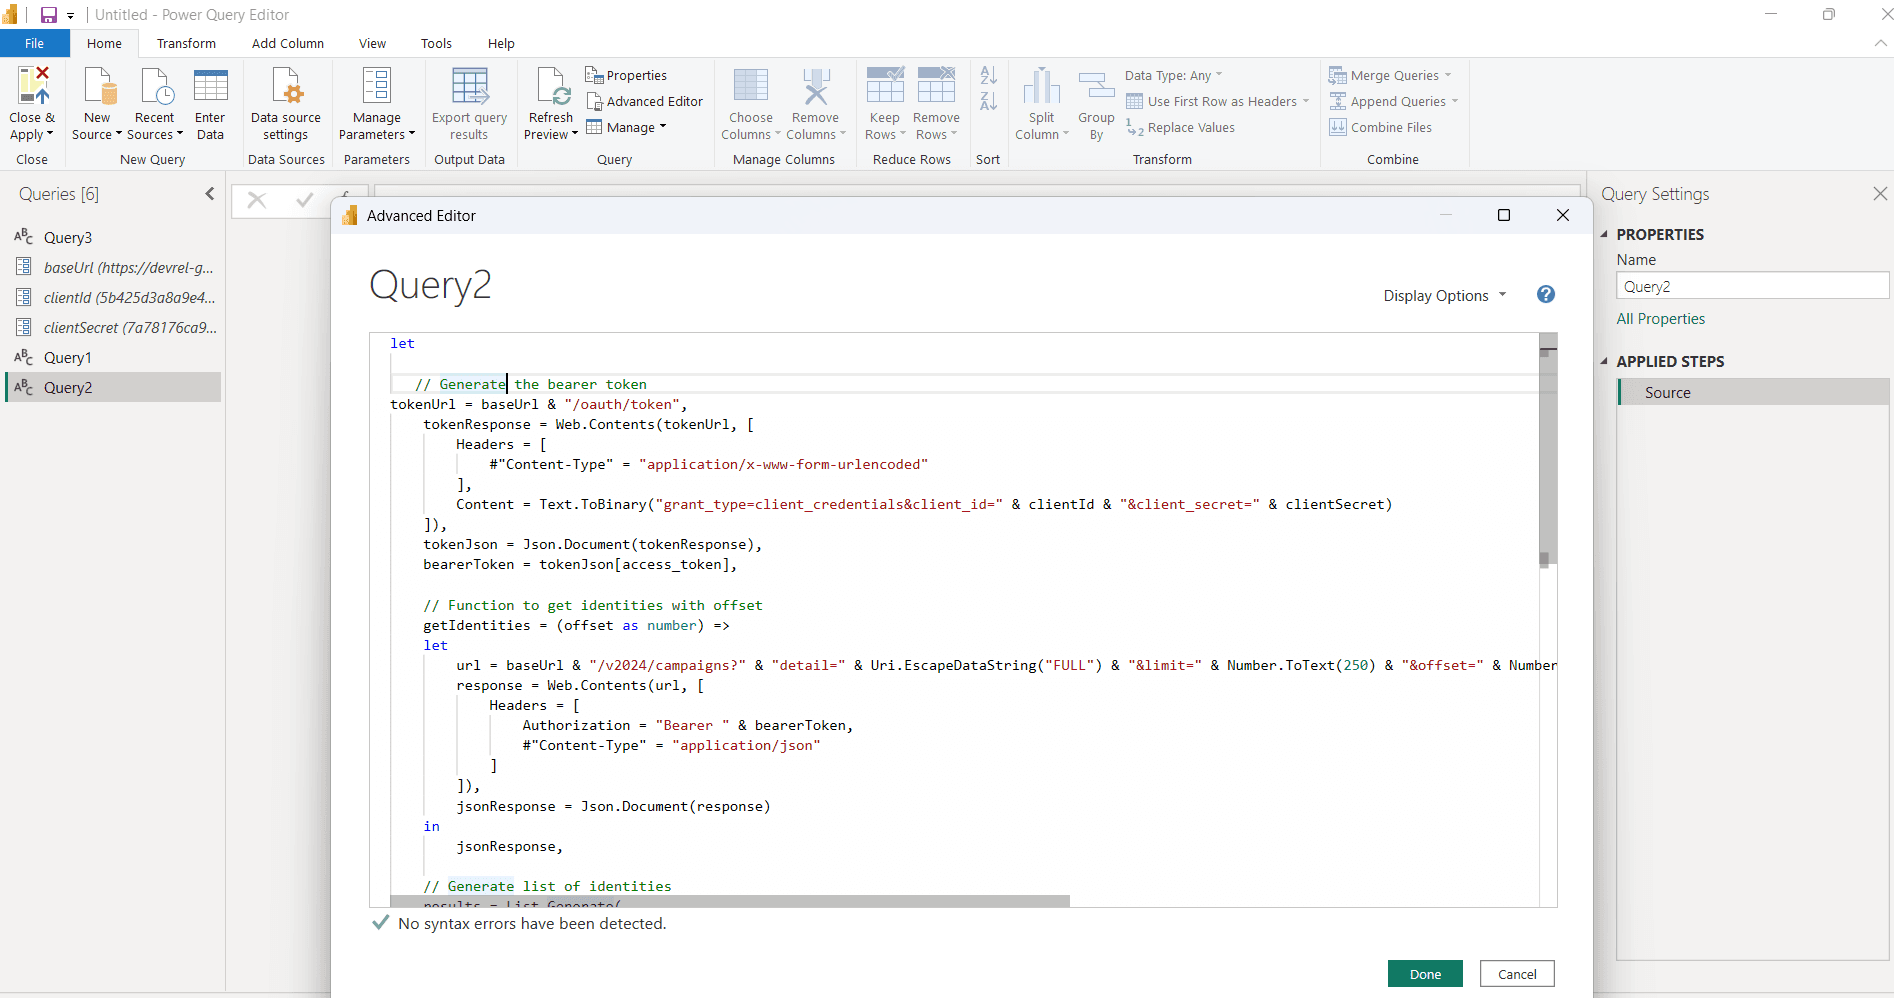
This script contains
Generates an OAuth Bearer Token
Calls the SailPoint ISC Campaigns API
Handles automatic pagination (offset + limit)
Collects all campaign records
Converts JSON response into a Power BI table
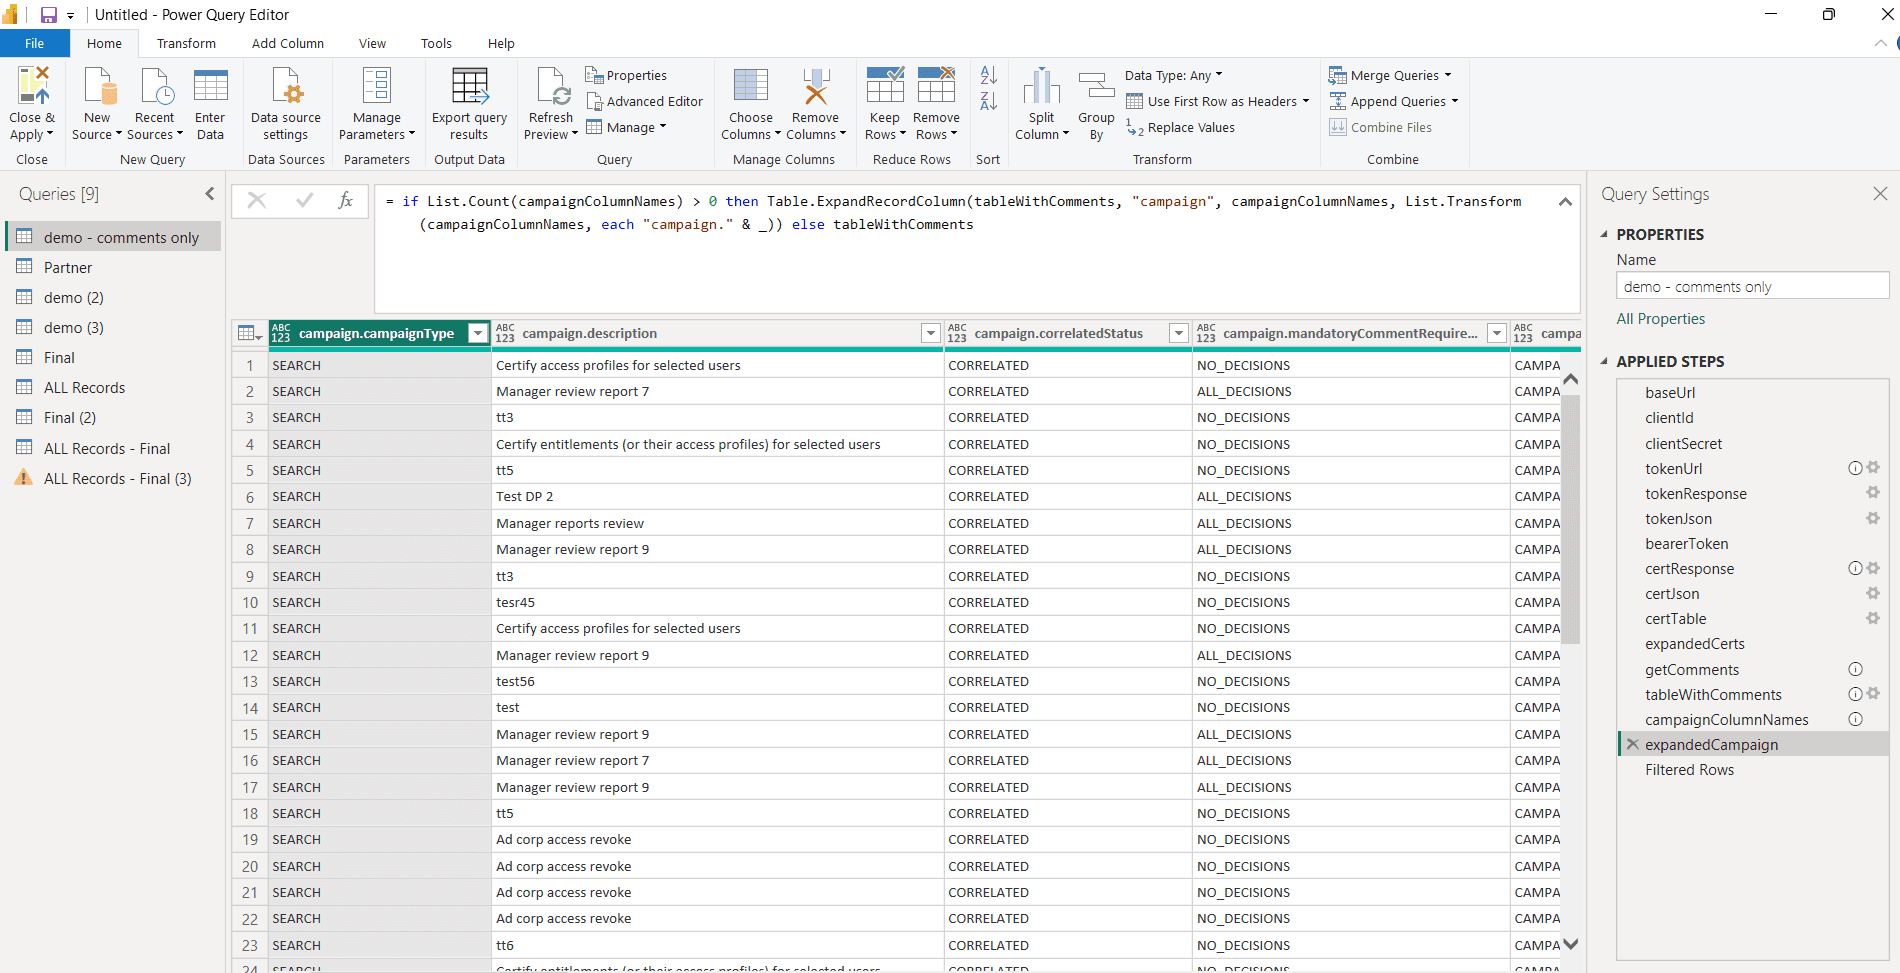
After the completion of code proceed with done. Then if authentication successful you will get all the records as in the form of tables.
Conclusion
This hands-on process shows how SailPoint ISC data can be integrated into Power BI using secure API authentication and automated pagination. The approach efficiently converts complex JSON responses into structured tables that are ready for reporting. Certification details, reviewer information, reassignment trails, access review items, and entitlement data become fully available for analysis. With this setup, Power BI transforms raw governance data into clear and actionable insights. The method reduces manual effort, supports audit needs, and enables flexible dashboards for identity governance decisions. With this setup, any SailPoint data can be pulled, transformed, and visualized quickly inside Power BI.
How to Build SailPoint Reports in Power BI Desktop
Introduction Of Building SailPoint Reports Using Power BI Desktop
The Power BI is the Microsoft's Business Intelligence tool for analytics and reporting. Here it converts data into dashboards, visuals, and interactive reports. It supports the real-time analytics, automated insights, and cloud-based sharing. Also, it uses in-memory VertiPaq engine for high-speed processing for generating the reports. The Power BI is suitable for business users, analysts, and IAM teams.
Why We Use Power BI
By using Power BI, it reduces manual reporting and simplifies complex data analysis and it provides a single place to view business KPIs and metrics. Helps decision-makers with interactive filtering and reports. BI Automates data refresh and reduces human error.
It connects more than 100 data sources from another data source. Using Power BI, we can create reports, dashboards, KPIs, scorecards, and custom visuals and can perform time-based analysis like YTD, QTD, YoY, and forecasting. Here it builds DAX measures for advanced calculations and business logic.
We can get data from another sources that includes,
Files – Excel, CSV, Json, Text, PDF, Folder
Databases – SQL Server, MYSQL, Sybase, Oracle, Access Databases
Microsoft Fabric – Dataflows, Warehouse, Lakehouse, KQL Databases
Power Platform – Power BI dataflows, Dataflows, Dataverse
Azure – Azure Database, Table Storage, Data Explorer, Resource Graph
Online Services – SharePoint online list, Salesforce objects & Reports, Google & Adobe analytics and other online service platforms.
Other Platforms like Web, Google Sheets, Get data from creating Blank Query
Power BI Components
Power BI Desktop: Data modeling, DAX, and report creation
Power BI Service: Online publishing, collaboration, scheduled refresh
Power BI Mobile: Access reports on phones & tablets
Power BI Gateway: Secure connection to on-premise data sources
Power Query: ETL transformation tool for cleaning data.
How Power BI Connects to SailPoint ISC
Power BI can connect to SailPoint ISC data for analytics and reporting and Identity data can be visualized in dashboards. It helps identity governance and compliance for provides real-time insights for decision-making and audit needs.
Connects SailPoint ISC using Base URL, PAT – Client Credentials
Data pulled using REST API
Can also load exported ISC data, reports.
What Data Power BI Can Use from SailPoint
Identity & accounts list
Entitlements, roles, access profiles
SOD violations & exceptions
Certifications & reports
Provisioning activity logs & reports
How to Connect to Data Sources
Open Power BI desktop, select a Data Source by clicking Get Data from Other Source option.
It will open the Power BI UI.
In the UI a prompt option will be display as in Picture 2.
In Get Data page -> Choose other option -> select Blank Query -> Connect
After connect the Power Query Editor gets open.
Connecting SailPoint ISC into the Power BI
In Power Query Editor, for ISC connection we need Base URL, PAT – Client ID, Client Credentials.
Adding the baseUrl, clientId, clientSecret in the parameters so you can don’t need to rewrite again.
To Create Parameters, go to Manage Parameters -> New Parameter then add Parameters one by one by clicking New in the same page.
Provide details like parameter name, add the url, id, secret in the Current Value field for each specified one and click ok.
The Parameters will add under the Query.
In Advance Editor, proceed with the connection logic.
This script contains
Generates an OAuth Bearer Token
Calls the SailPoint ISC Campaigns API
Handles automatic pagination (offset + limit)
Collects all campaign records
Converts JSON response into a Power BI table
After the completion of code proceed with done. Then if authentication successful you will get all the records as in the form of tables.
Conclusion
This hands-on process shows how SailPoint ISC data can be integrated into Power BI using secure API authentication and automated pagination. The approach efficiently converts complex JSON responses into structured tables that are ready for reporting. Certification details, reviewer information, reassignment trails, access review items, and entitlement data become fully available for analysis. With this setup, Power BI transforms raw governance data into clear and actionable insights. The method reduces manual effort, supports audit needs, and enables flexible dashboards for identity governance decisions. With this setup, any SailPoint data can be pulled, transformed, and visualized quickly inside Power BI.
Stay tuned to our blog to see more posts about
Sailpoint products implementation and its related updates.
Stay tuned to our blog to see more posts about SailPoint products implementation and its related updates.
Category:
Category:
Security
Security
How to Build SailPoint Reports in Power BI Desktop
Introduction Of Building SailPoint Reports Using Power BI Desktop
The Power BI is the Microsoft's Business Intelligence tool for analytics and reporting. Here it converts data into dashboards, visuals, and interactive reports. It supports the real-time analytics, automated insights, and cloud-based sharing. Also, it uses in-memory VertiPaq engine for high-speed processing for generating the reports. The Power BI is suitable for business users, analysts, and IAM teams.
Why We Use Power BI
By using Power BI, it reduces manual reporting and simplifies complex data analysis and it provides a single place to view business KPIs and metrics. Helps decision-makers with interactive filtering and reports. BI Automates data refresh and reduces human error.
It connects more than 100 data sources from another data source. Using Power BI, we can create reports, dashboards, KPIs, scorecards, and custom visuals and can perform time-based analysis like YTD, QTD, YoY, and forecasting. Here it builds DAX measures for advanced calculations and business logic.
We can get data from another sources that includes,
Files – Excel, CSV, Json, Text, PDF, Folder
Databases – SQL Server, MYSQL, Sybase, Oracle, Access Databases
Microsoft Fabric – Dataflows, Warehouse, Lakehouse, KQL Databases
Power Platform – Power BI dataflows, Dataflows, Dataverse
Azure – Azure Database, Table Storage, Data Explorer, Resource Graph
Online Services – SharePoint online list, Salesforce objects & Reports, Google & Adobe analytics and other online service platforms.
Other Platforms like Web, Google Sheets, Get data from creating Blank Query
Power BI Components
Power BI Desktop: Data modeling, DAX, and report creation
Power BI Service: Online publishing, collaboration, scheduled refresh
Power BI Mobile: Access reports on phones & tablets
Power BI Gateway: Secure connection to on-premise data sources
Power Query: ETL transformation tool for cleaning data.
How Power BI Connects to SailPoint ISC
Power BI can connect to SailPoint ISC data for analytics and reporting and Identity data can be visualized in dashboards. It helps identity governance and compliance for provides real-time insights for decision-making and audit needs.
Connects SailPoint ISC using Base URL, PAT – Client Credentials
Data pulled using REST API
Can also load exported ISC data, reports.
What Data Power BI Can Use from SailPoint
Identity & accounts list
Entitlements, roles, access profiles
SOD violations & exceptions
Certifications & reports
Provisioning activity logs & reports
How to Connect to Data Sources
Open Power BI desktop, select a Data Source by clicking Get Data from Other Source option.
It will open the Power BI UI.
In the UI a prompt option will be display as in Picture 2.
In Get Data page -> Choose other option -> select Blank Query -> Connect
After connect the Power Query Editor gets open.
Connecting SailPoint ISC into the Power BI
In Power Query Editor, for ISC connection we need Base URL, PAT – Client ID, Client Credentials.
Adding the baseUrl, clientId, clientSecret in the parameters so you can don’t need to rewrite again.
To Create Parameters, go to Manage Parameters -> New Parameter then add Parameters one by one by clicking New in the same page.
Provide details like parameter name, add the url, id, secret in the Current Value field for each specified one and click ok.
The Parameters will add under the Query.
In Advance Editor, proceed with the connection logic.
This script contains
Generates an OAuth Bearer Token
Calls the SailPoint ISC Campaigns API
Handles automatic pagination (offset + limit)
Collects all campaign records
Converts JSON response into a Power BI table
After the completion of code proceed with done. Then if authentication successful you will get all the records as in the form of tables.
Conclusion
This hands-on process shows how SailPoint ISC data can be integrated into Power BI using secure API authentication and automated pagination. The approach efficiently converts complex JSON responses into structured tables that are ready for reporting. Certification details, reviewer information, reassignment trails, access review items, and entitlement data become fully available for analysis. With this setup, Power BI transforms raw governance data into clear and actionable insights. The method reduces manual effort, supports audit needs, and enables flexible dashboards for identity governance decisions. With this setup, any SailPoint data can be pulled, transformed, and visualized quickly inside Power BI.
Stay tuned to our blog to see more posts about
Sailpoint products implementation and its related updates.
Category:
Security


